
advertisements
Tracking the Stock Market
with Astrology
by Michael O'Reilly
What astrological factors influence market trends and turning points? Here's Part Two, an excerpt from the full length article featured in Dell Horoscope magazine's May 2010 issue... Here's Part One
NeptuneCafe presents

A Case Study: The March 6, 2009 V-Shaped Bottom
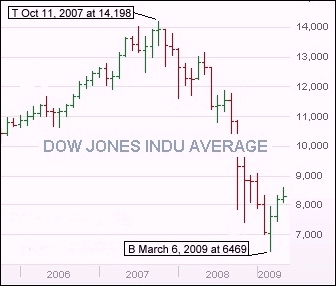
My feeling is that each of these three indicators has predictive value: planetary cycles, the NYSE and the US horoscope. As an example of how they might work, here's a look at the March 6, 2009 market bottom. The Dow had hit its all-time high of 14,198 on October 11, 2007. Most everyone who had invested in the stock market after that date, or who didn't pull their money out then, lost money. By October 2008, markets went into a tailspin when the Bush administration declined to bail out the venerated investment giant Lehman Brothers. The Dow fell a breath-taking 2,000 points in two panic-filled weeks.
By November the bottom still hadn't been reached after the Dow fell an additional 1000 points. This market was looking as bad as the market after the Great Crash of 1929, and included the widespread fear that the entire economy could collapse. Not until March 6, 2009 did the Dow finally hit absolute bottom at 6469, some 55 percent below its peak only 18 months earlier. Anyone who invested in the market in the beginning of March 2009 saw rapid increased value in their portfolio over the coming months. It didn't matter if you bought stocks in the financial, technology, or retail sectors; if you were in the market after March 6, 2009, you were making money.
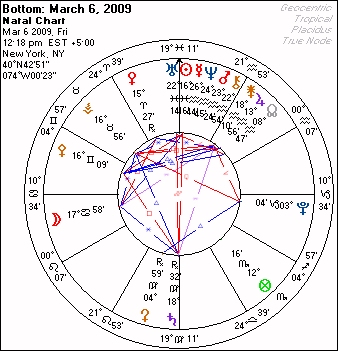
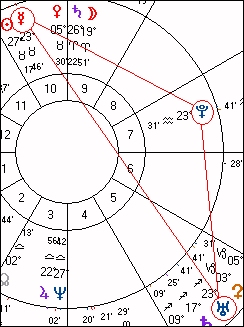
In terms of planetary cycles, a look at the chart for Friday March 6, 2009 (12:18 pm; New York, NY) gives some clues about this important turning point. The Sun is entering the critical Saturn-Uranus opposition, and by the next business day on March 9 was separating from the opposition to Saturn and applying to the conjunction with Uranus. When looking for turning points, the fast-moving planets, and especially the Sun and Mars, can trigger the outer planet indicators. If the hard Saturn-Uranus opposition is within a few degrees, then any Sun or Mars transit through this area of the zodiac can lead to a significant reversal.
Another big clue is that Venus turned retrograde on March 6 (at 12:18 pm EST). The Venus retrograde cycle unfolds every two years, and like clockwork, its stations correspond to trend reversals. However, rarely do they signify the kind of major bottom that was experienced here. A few financial astrologers actually picked the Venus station as marking a reversal, but none saw that it was the historic, long-term reversal that it eventually turned out to be.
Check out the trend reversals during the previous Venus retrograde and direct cycle. The Dow and other U.S. markets were trending up in 2007, hitting a high of 14,021 on July 17. Over the next few trading sessions, the Dow hovered in the 14,000 area. Then on July 26, the day that Venus turned retrograde, the Dow fell 226 points, and continued downward over the next few weeks. Not until Venus turned direct on September 7 was it safe to start buying again. So Venus stations suggest short term reversals, blips in the big picture. Other factors have to be involved if the Venus station is cited as the bottom of a V-shaped recovery, such as the one that unfolded after March 6, 2009.
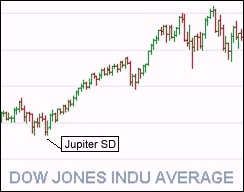
The cluster of planets in Aquarius is the third major indicator. Financial astrologers often see major reversals when three or more planets come together. Here we had four planets and two asteroids (Juno and Chiron) all within 13 degrees of Aquarius, a sure sign that some new beginning was taking place. So a shrewd financial astrologer might look at these three planetary cycles – the Sun entering the Saturn-Uranus polarity, the Venus station, and the Aquarius cluster – and figure out that March 6, 2009 was the critical turning point. But it's a leap of faith to suggest that this is all you need to know to understand market trends.
The NYSE
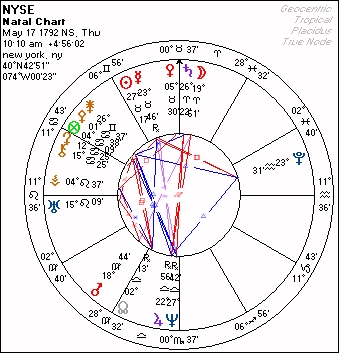
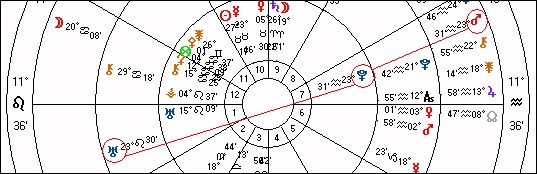
The conditions of the NYSE provide confirmation, or may be read on its own terms to understand this date as the inflection point. First, let's have a look at this chart's basic dynamics. A see-saw pattern is presented by the opposition between the Moon and Saturn in Aries as they oppose the Jupiter-Neptune conjunction in Libra. This configuration suggests the underlying rhythms of the stock market: expansion and contraction at regular intervals.
The Sun in Taurus trines Mars in Virgo, a practical combination beneficial for long term financial growth. The Leo Ascendant describes the proud, confident nature of the NYSE and its participating investors. Since Leo is Rising, the Sun is the natural ruler of this horoscope. Major outer planet transits and progressions to the Sun are clues to trends and turning points. The progressed Sun is also relevant, as we shall see later.
With quirky Uranus right on the Leo Ascendant, we get a picture of the market's unpredictable movements. Uranus here is also favorable to new and innovative companies, especially those that feature new technologies. Uranus forms a supportive trine to the Moon, so that the overall trends – as volatile and unpredictable as they might be – move up in the long run. Uranus conjunct the Ascendant means that this planet is the co-ruler of this horoscope. Major transits and progressions to Uranus signify major trends and turning points. Also, transiting Uranus's contacts with natal placements or progressions becomes extra significant.
Some financial astrologers will tell you that Venus at the Midheaven is unaspected, but this is not true. In traditional astrology, Venus opposes Neptune, even though the orb is 8º and it's an out-of-sign connection. Venus is in a close square to Vesta (associated with investments) and nearly exactly sextile the Part of Fortune. The conjunction with the Midheaven is also relevant. So Venus in Taurus is strongly placed and represents the overall, achievable goal of financial security.
The tightest aspect between the traditional planets, and therefore the strongest vector for fundamental changes when activated, is the Mercury-Pluto square. This Mercury-Pluto dynamic describes the intense analytical interest in understanding market forces. The Mercury-Pluto combination is interested in market psychology, and when activated, can describe unbridled greed (Mercury in Taurus propelled by Pluto) which suddenly reverses into panic.
When transiting Uranus aspects the NYSE Mercury-Pluto square, big movements may be unfolding. This is not always a good thing, especially if the market has been running up. The worst crashes have consistently involved transiting Uranus and the Mercury-Pluto square. On Black Thursday, October 28, 1929, transiting Uranus was at 8º Aries, which is the precise midpoint between the NYSE Mercury and Pluto.
Before a great crash can occur, the market has to become hyper-inflated. Prices keep going up, though everyone knows in their hearts that the party has to end soon. But the run-ups can last a while before they do, and no one wants to be left out of the big gains. Again, on October 19, 1987 – the next big crash date – transiting Uranus was at 23º Sagittarius, where it formed a quincunx to natal Mercury and a sextile to natal Pluto. The orb for the Mercury connection was only 0º06', showing how precise of an indicator transiting Uranus can be. During the 1929 crash, Uranus was only 0º07' from its octile (45º) to natal Pluto.
This Uranus to Mercury-Pluto combination is one of the keys to the Dow's run-up to 14,000 and then its sudden and precipitous collapse. As the above examples show, the turning points arrive when the Uranus connection is within a very tight orb. This is in accordance with the nature of Uranus, which can be observed in individuals' personal lives and in geopolitics in general.
The other key is Pluto. The background situation leading to the Dow's peak at 14,000 included a rare but powerful alignment between transiting Pluto and the progressed Sun. They were both hovering around 27º Sagittarius throughout 2007 as the Dow headed upwards. This degree is known to be extra special since it's conjunct the Galactic Center. The top was reached on October 11, 2007 as transiting Jupiter and Uranus squared each other while also closely aspecting the NYSE Uranus (orb 0º22').
Pluto's nature in financial astrology is not unknown, nor is it worthless. Pluto can empower or lead to collapse. In this case, it did both. During the months of October, November and December 2008, investors were desperately looking for a safe haven for their cash. This was when transiting Pluto and the progressed NYSE Sun were advancing precisely in tandem through late Sagittarius.
Returning to the Uranus influence over the NYSE Mercury-Pluto square, a simultaneous development centered on progressed Uranus. Outer planet progressions are rarely considered because they move so slowly. But when they are exact, they can bring the biggest changes. The NYSE progressed Uranus moves glacially slow, only about 0º01' per year. Since the birth of the NYSE in 1792, progressed Uranus has only advanced from 15º Leo to 23º Leo. But notice that the natal Mercury-Pluto square is at 23º Aquarius and Taurus. So progressed Uranus had entered the critical Mercury-Pluto dynamic. This, along with the transiting Pluto-progressed Sun dynamic, were creating historic conditions in the U.S. stock markets.
Using advanced astrology software is the only way to know when progressed Uranus would be exactly opposite the NYSE Pluto. Even so, because of the incremental changes from one day to the next, one will still be finding an estimate. My SolarFire software told me that progressed Uranus was opposite the NYSE Pluto on March 30, 2008 and within 0º01' plus or minus one year. In this two year interval, the stock market indices were extremely volatile, with the Dow reaching its all-time high, followed by the breath-taking plummet. The markets turned sharply and irrevocably downward as this aspect was exact.

Also, the Venus station (one of the main three indicators in the planetary cycles section above) took place at 15º Aries, exactly trine the NYSE Uranus. There are more indicators, but the point here is that the NYSE reveals the Big Picture, much more so than by using the planetary cycles alone, as practiced by many financial astrologers.
One could fine-tune the Uranus influence through other connections with the NYSE. Most significantly, transiting Mars was conjunct the NYSE Pluto, triggering the underlying Uranus progression on the day of the bottom on March 6, 2009.


Advertise on this site.
For more info, email wolfstar@neptunecafe.com
this article began here:
Part One - Charting the Financial Trends
and continues here:
Part Three - the U.S. horoscope's role
Part Four - Blending Planetary Cycles